Finding Undervalued Skins
Discover hidden gems and profit opportunities
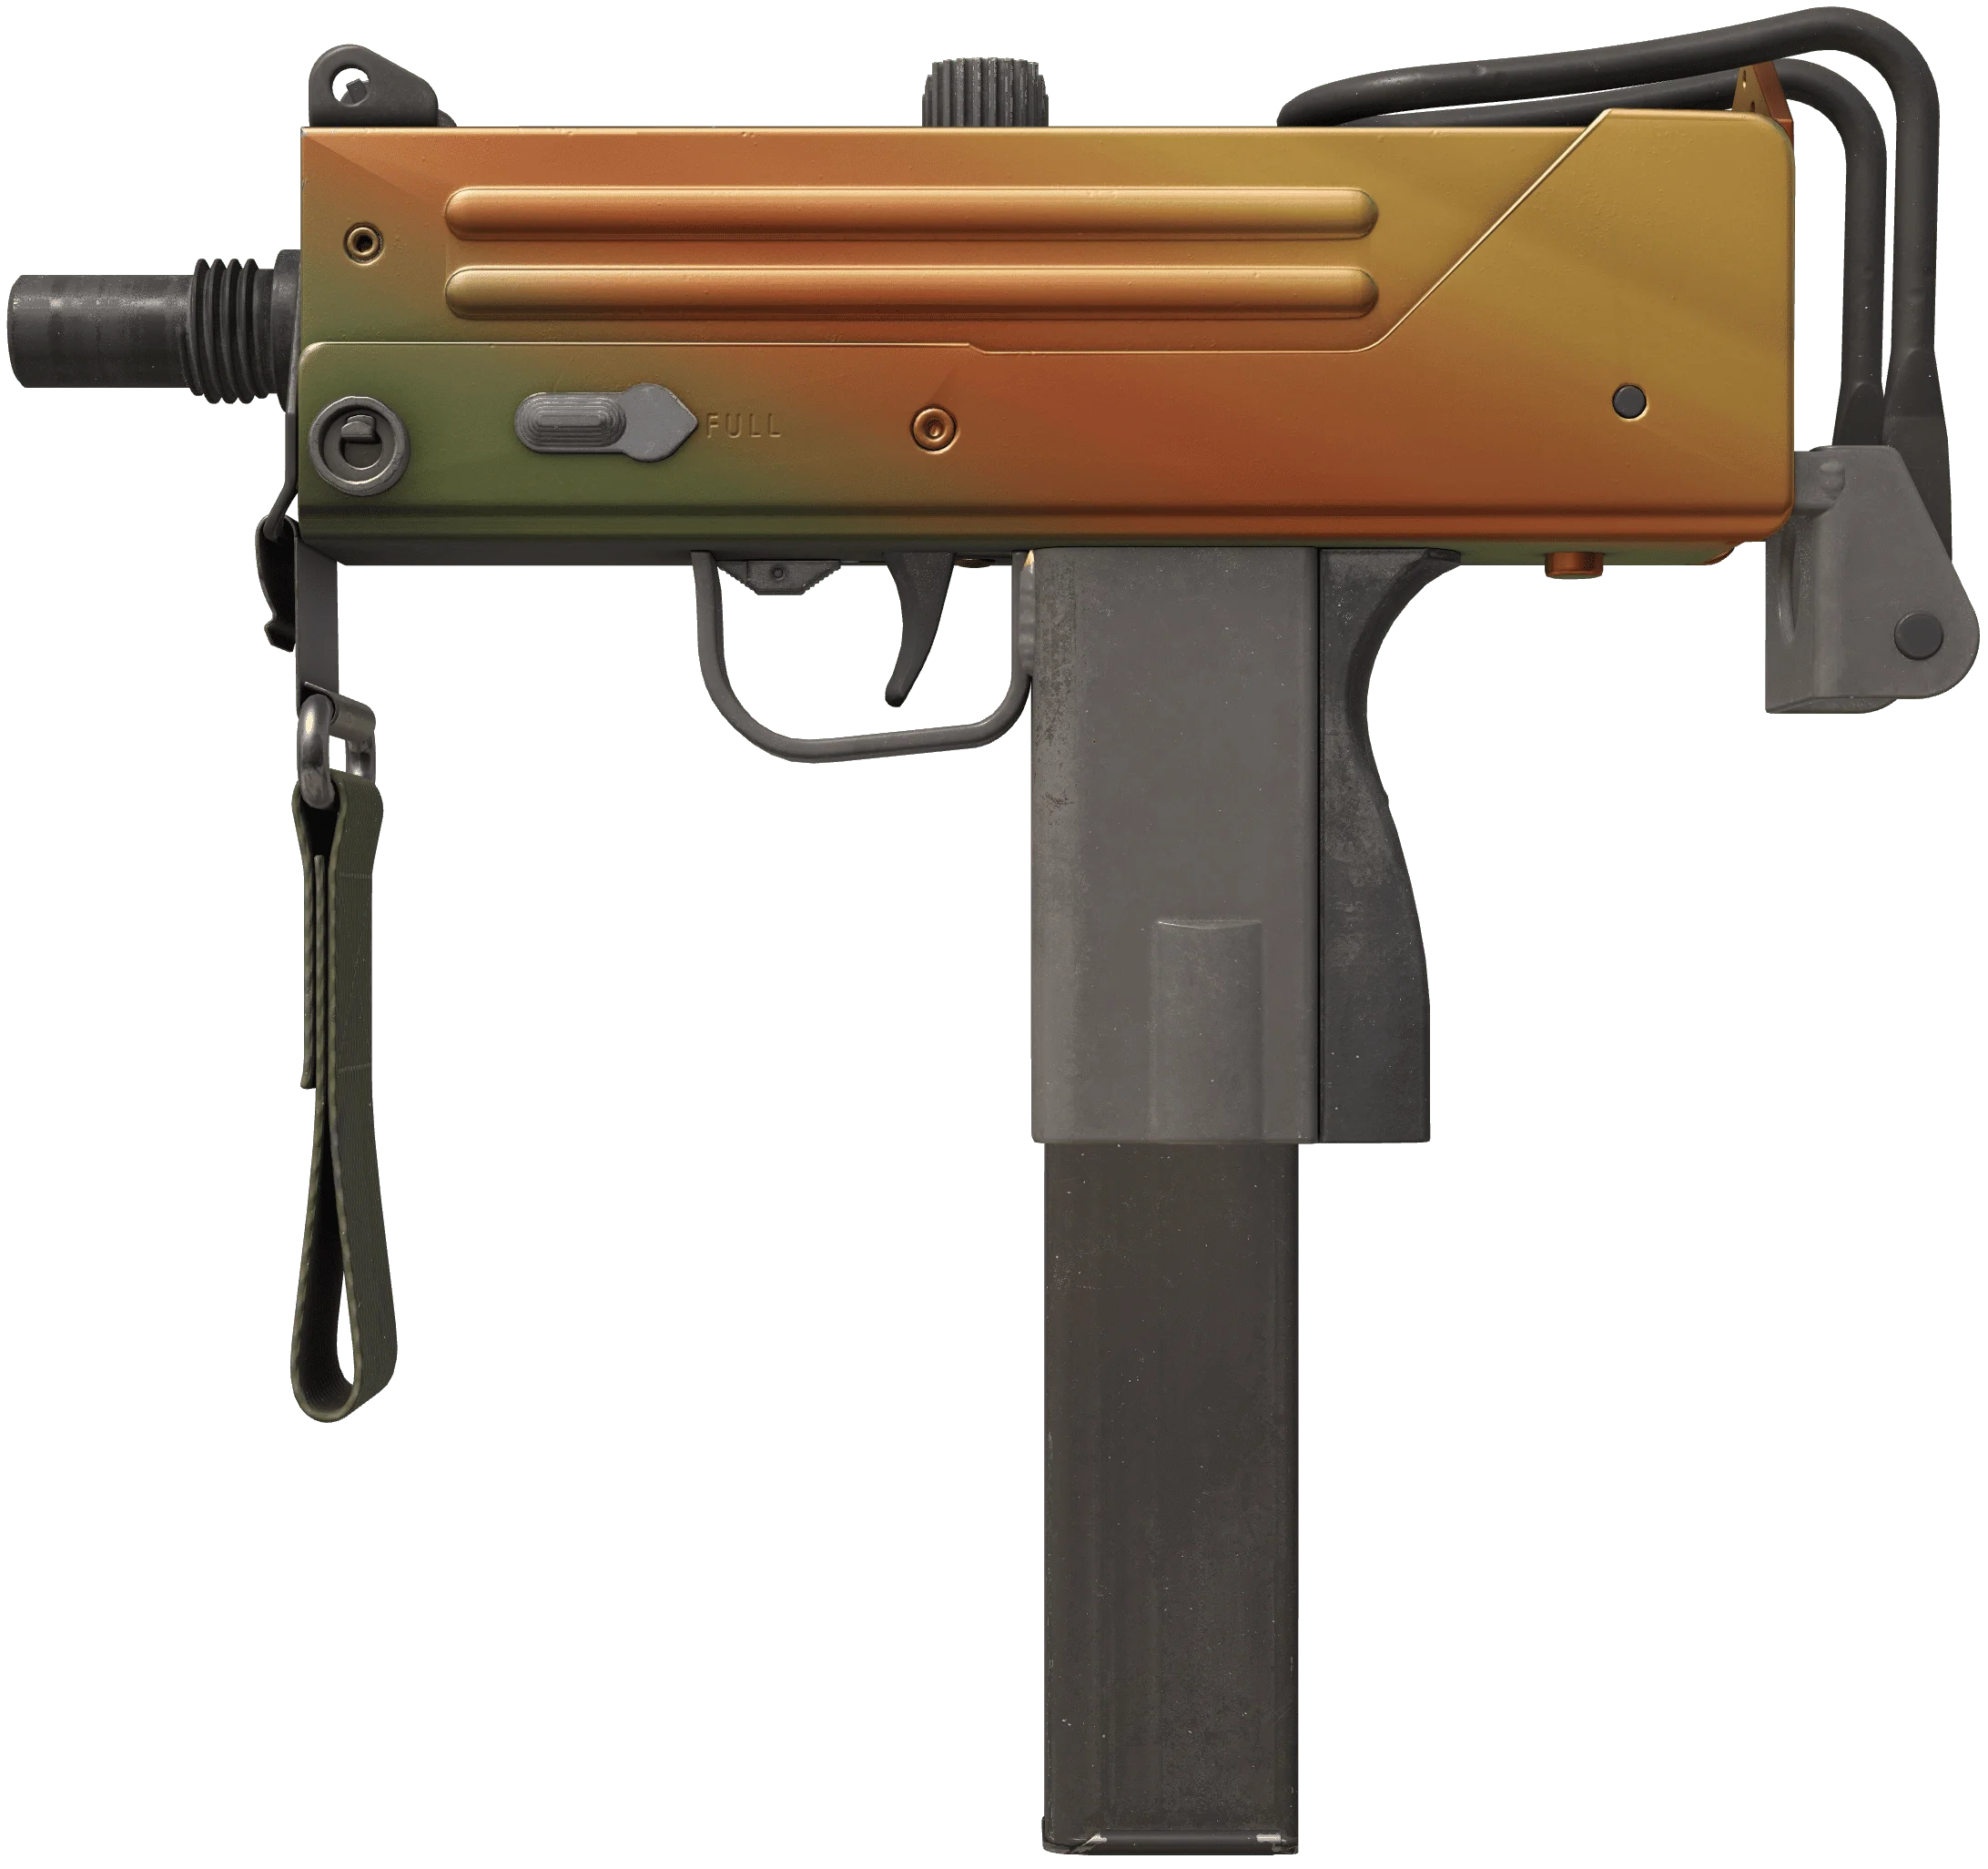
How to Spot Undervalued CS2 Skins
A CS2 skin is undervalued when its market price is below its intrinsic value based on rarity, demand, float value, sticker value, pattern quality, and market trends.
Undervaluation usually comes from market inefficiency, lack of seller awareness, temporary oversupply, or complex item traits that casual traders do not price correctly.
Valuation Metrics
Price vs Historical Average
Compare current price to 30, 90, and 180-day averages.
- Importance: Critical
- Look for 15%+ discounts from historical norms
- Formula: (Current Price / Average Price) - 1
- Example: AK Redline at $25 vs $30 average = -16.7%
Sticker Value Ratio
Calculate sticker value versus the premium added to the skin.
- Importance: High
- Find skins where stickers add less than 5% to price
- Formula: (Skin Price - Base Price) / Total Sticker Value
Float Value Premium
Assess whether a low float commands the correct premium.
- Importance: High
- Compare similar floats across the same skin
- Example: 0.00x float selling for the same as 0.15 can be an opportunity
Supply and Demand Ratio
Compare active listings to daily sales volume.
- Importance: Critical
- Low supply plus high volume creates price pressure
- Formula: Active Listings / Daily Sales Volume
Cross-Market Arbitrage
Compare price gaps across platforms.
- Importance: Medium
- Find 10%+ gaps between markets
- Example: Buff at $100 and Steam at $120 = 20% arbitrage
Comparable Sales Analysis
Use similar skins and patterns as price anchors.
- Importance: High
- Identify outliers in the same category
- Example: Blue Gem #179 selling at 50% of similar patterns
Analysis Checklist
Check Historical Prices
Review six-month price history for patterns.
- Tools: Price tracking sites, market history
Verify Supply Metrics
Count active listings across all markets.
- Tools: Market aggregators, manual counting
Analyze Demand Signals
Check daily volume and buy orders.
- Tools: Volume trackers, order books
Compare Similar Items
Find price anchors in the same category.
- Tools: Filter searches, pattern databases
Calculate True Value
Factor in all premiums and discounts.
- Tools: Spreadsheets, value calculators
Assess Risk and Reward
Determine upside potential versus downside.
- Tools: Portfolio trackers, risk metrics
Example Opportunities
| Category | Reason | Upside | Risk | Action |
|---|---|---|---|---|
| Low Float Industrial Skins | Collectors discovering cheap perfection | 5-10x | Low | Buy any <0.001 float near base price |
| Old Souvenir Packages | Supply finite, specific matches rare | 2-5x | Medium | Target major finals and popular teams |
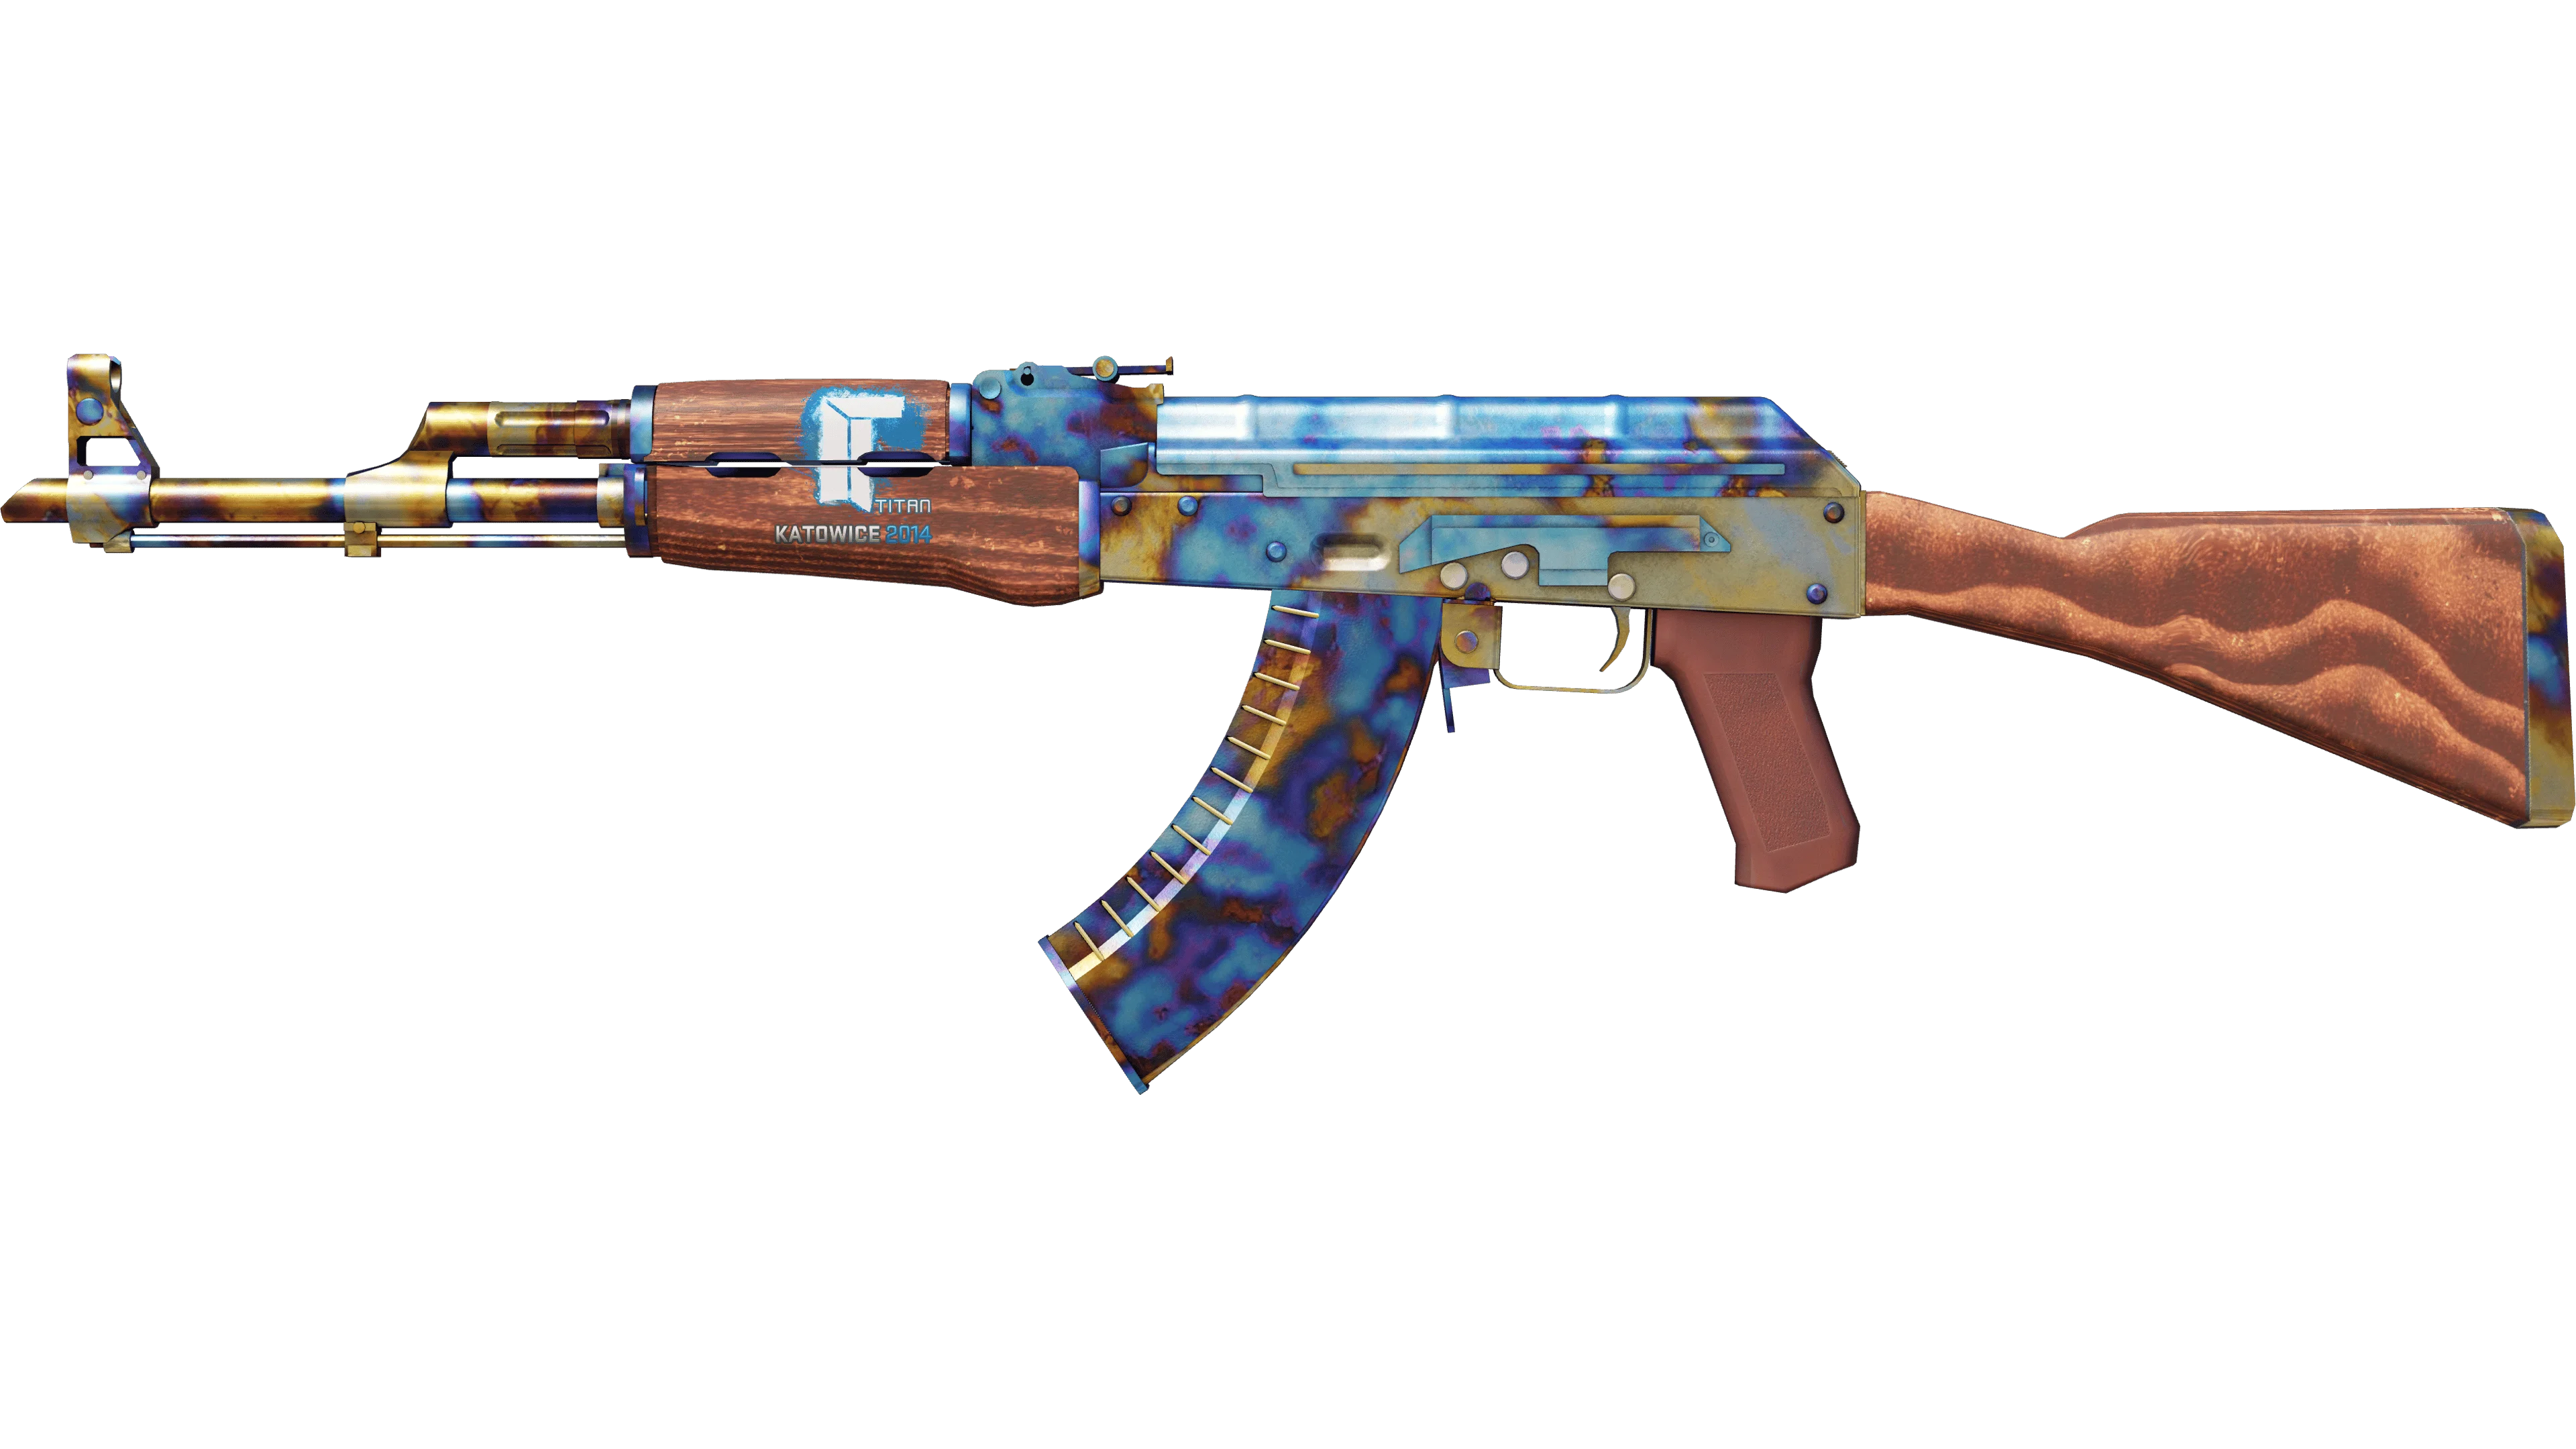
| Katowice 2014 Crafts | Stickers alone worth more than asking | 1.5-3x | Low | Calculate sticker % carefully |
| Discontinued Collection Skins | No new supply entering market | 2-4x | Low | Focus on play skins, not investments |
Red Flags to Avoid
Recent Massive Spike
Likely manipulation or FOMO peak.
Single Market Listing
Creates price manipulation risk.
Upcoming Operation Items
May return to the drop pool.
Duped Items
Multiple identical items hurt value.
Trade Banned Prevalence
A high percentage locked hurts liquidity.
No Trade History
Impossible to verify fair value.
Investment Strategies
| Strategy | Description | Budget | Timeline | Expected return | Difficulty |
|---|---|---|---|---|---|
| Float Mining | Buy lowest floats of common skins | $50-500 | 3-6 months | 200-1000% | Easy |
| Sticker Hunting | Find undervalued sticker combinations | $100-5000 | 1-4 weeks | 50-200% | Medium |
| Operation Investing | Buy operation skins post-event | $500-5000 | 6-12 months | 100-300% | Easy |
| Pattern Arbitrage | Flip misidentified rare patterns | $1000+ | Immediate | 50-500% | Hard |
Valuation Tools
Historical Price Charts
Identify price patterns and cycles.
Float Value Databases
Find comparative pricing for floats.
Sticker Calculators
Calculate true sticker premiums.
Supply Trackers
Monitor market supply changes.
Trade-Up Calculators
Find undervalued trade-up inputs.
Pattern Checkers
Verify rare pattern claims.
Undervalued Skins FAQ
A CS2 skin is undervalued when its market price is below its intrinsic value based on factors like rarity, demand, float value, sticker value, pattern quality, and market trends. This can occur due to market inefficiencies, lack of awareness, or temporary oversupply.
Calculate true value by analyzing base skin price trends, sticker value, float value premiums, pattern rarity, historical price data, supply and demand dynamics, and comparable sales. Use multiple data sources for accuracy.
The best categories include low-float industrial and Mil-Spec skins, old operation skins with declining supply, trade-up food skins, souvenir skins from minor tournaments, and skins with expensive stickers selling near base price.
Appreciation timeframes vary: sticker plays may take 1-4 weeks, operation skins 3-6 months, discontinued skins 6-12 months, and collection investments 1-2 years. Market conditions and game updates significantly affect timing.